10 Customer Onboarding Metrics and KPIs You Must Track

Key Highlights:
- Customer onboarding metrics are KPIs that track how new users move from sign-up to product value without churn.
- Only 37.5% of new SaaS users complete onboarding, making client onboarding KPIs the most underleveraged retention tool.
- Metrics such as time-to-value, activation rate. customer health score and drop-off rate give real-time visibility into onboarding performance.
Ever wondered why most of your new customers sign up but quietly disappear before they understand the real value of your product? The hard truth is that most businesses are missing a reliable system to measure onboarding success.
According to the report, only 1 of 3 new SaaS users 37.5% completed onboarding and became active product users. It is not your product problem, but an onboarding measurement problem that can be fixed using tracking metrics.
So what exactly should be tracked and where to start? Explore the most critical customer onboarding metrics and KPIs. It includes metrics such as time-to-value, activation rate, health score and drop-off rate. Also, understand which KPIs move best for measuring retention and how to optimize them before churn becomes inevitable.
What Is Customer Onboarding?
Customer onboarding is a process of guiding new users from sign-up to a complete experience that values your product or service. It is the foundation that shapes every customer relationship going forward, as it is non-negotiable.
Customer onboarding metrics and KPIs give you the real picture of how well this process performs to improve user experience. 62% of teams still lack real-time visibility into sign-up progress, which means making decisions blindly without the data that they need.
Key objectives that client onboarding metrics achieve:
- Activation: Help customers reach their first meaningful “wow moment” faster.
- Customer engagement rate: Measure how users are interacting during the onboarding phase.
- Adoption: Track if customers are using core features that drive long-term success.
- Retention: Identify early risk of customer churn.
- Conversion: Monitor the seamless movement of onboarded users from trial or free tiers to paying customers.
Why It’s Important to Track Customer Onboarding Metrics and KPIs
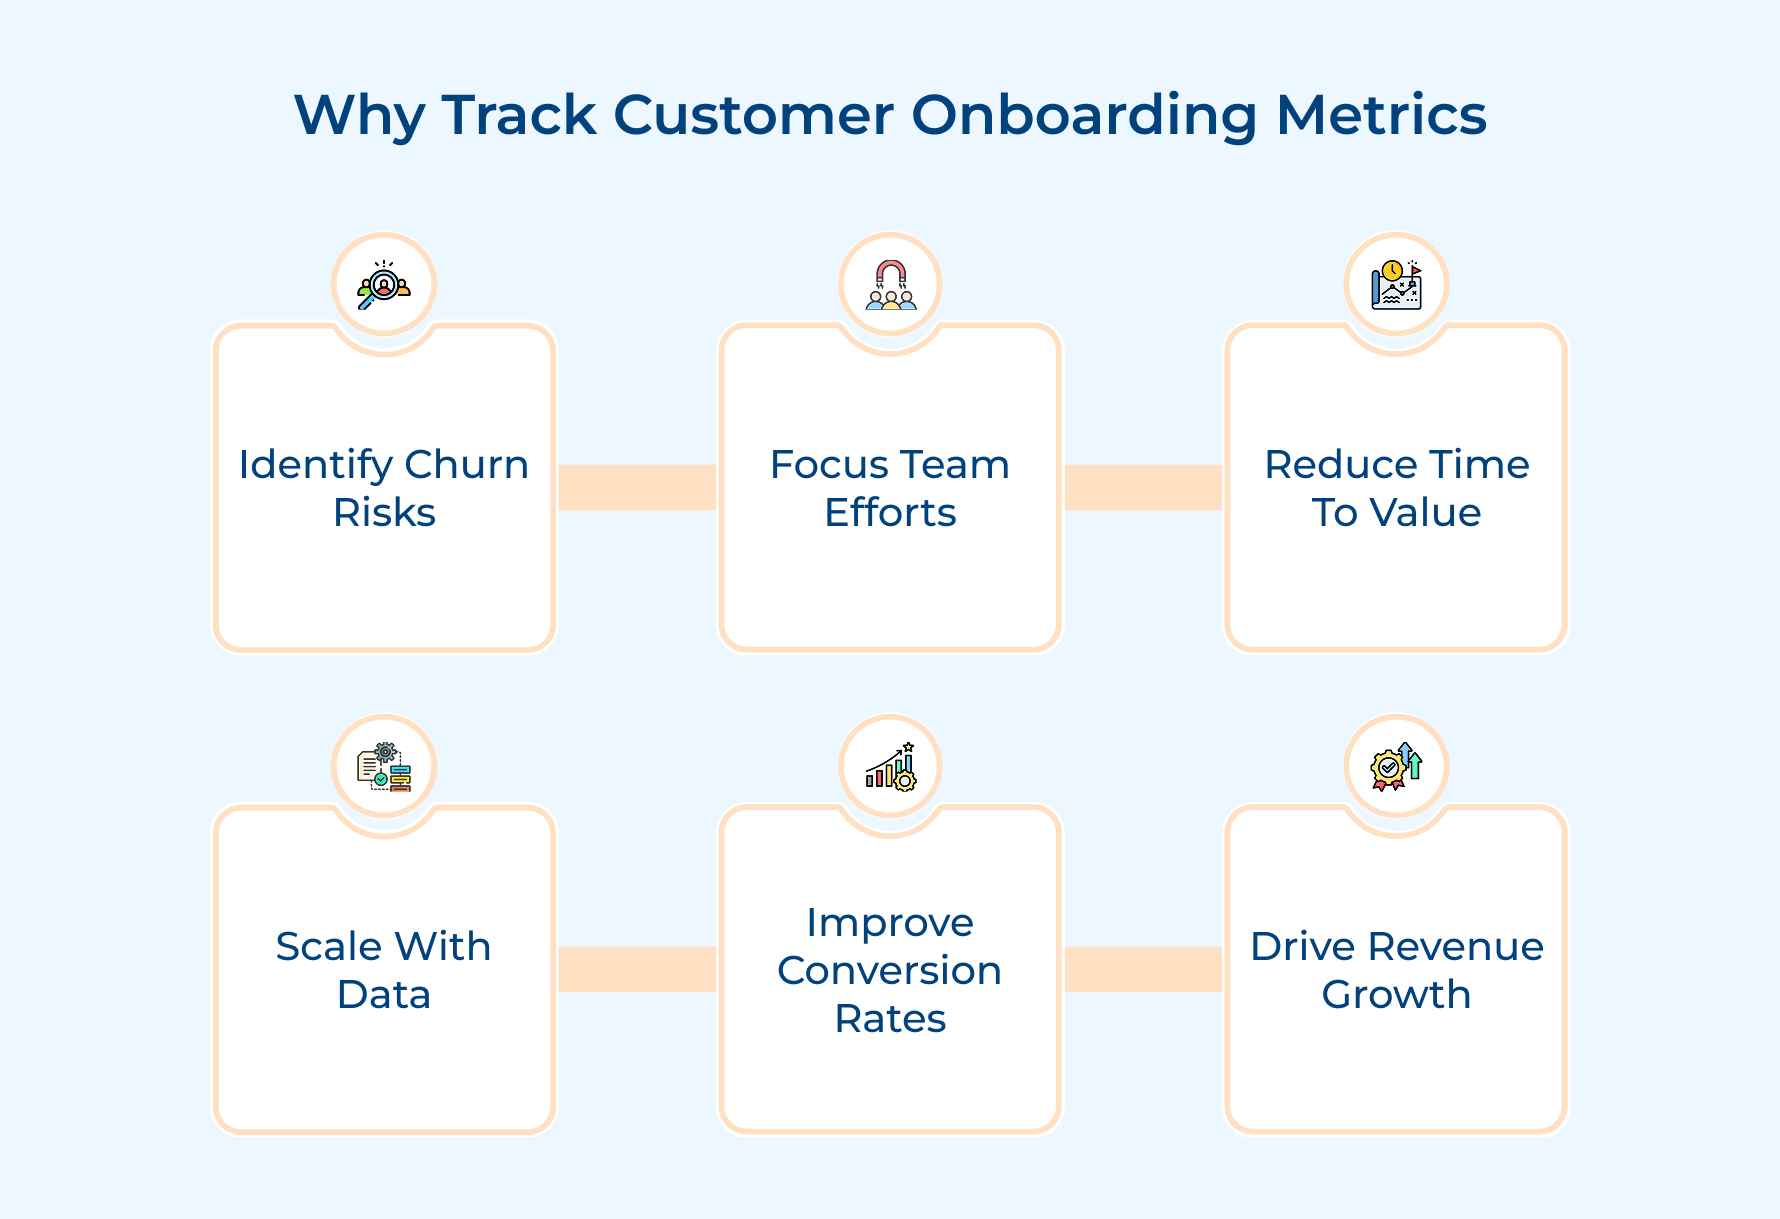
Track onboarding metrics and KPIs to identify what is working, what is not, and where customers are slipping in the current process..
Spot Drop-Off Points Before They Become Churn
Most onboarding failures happen at specific steps where customers lose momentum. Identify exact touchpoint where engagement drops helps you to fix the friction before it costs you a renewal.
Align Your Team Around What Actually Matters
The biggest internal challenge most onboarding teams face is that CS, product, and sales all measure different points. A standardized list of metrics and KPIs enables every team to move toward the same definition of successful customer onboarding for most SaaS products.
You Reduce Time-to-Value for Every New Customer
Time-to-value shows how quickly your customer gets a return from their buying decision. The faster you measure and optimize the journey, the stronger your retention becomes within the first 90 days of the signup.
Build a Scalable Onboarding Process Backed by Data
Onboarding with guesswork is ideal for 20 customers, but fails for 200 or 2,000 users without proper planning. Consistent client onboarding KPIs provide a repeatable framework for teams to scale without sacrificing the quality of the user experience.
Increase Revenue by Improving Conversion at the Right Stage
Onboarding is more than just a post-sale activity. It is the highest-leverage conversion point within the entire customer lifecycle. Track it during onboarding to predict paid conversion and act early for expanding accounts faster.
Turn Onboarding Into a Strategic Business Asset
Many companies treat onboarding as a customer support function instead of a growth driver. Customer onboarding metrics combine with revenue outcomes to build a strong internal case for retention, upsell and advocacy.
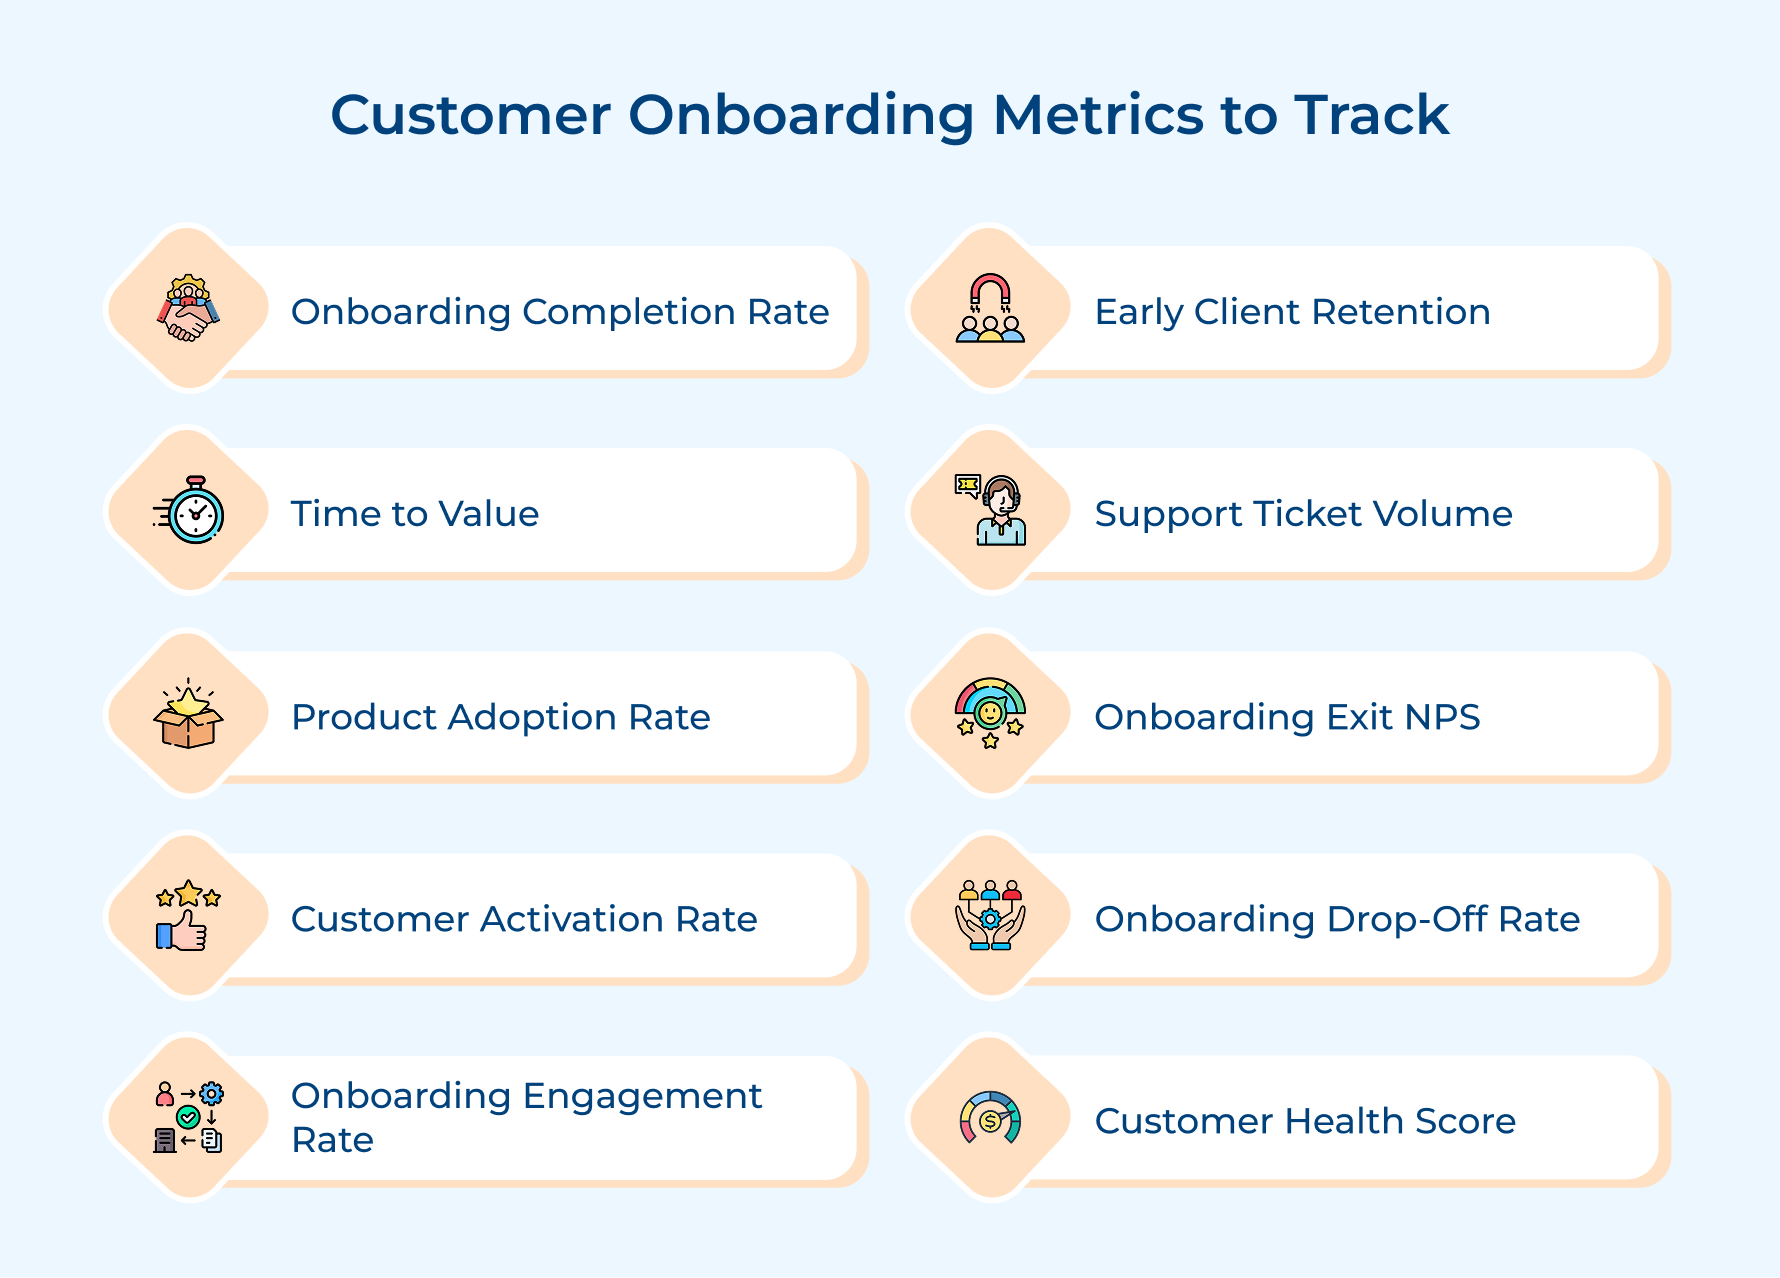
Top 10 Customer Onboarding Metrics and KPIs to Track
Explore the top Metrics to separate teams that grow predictably from teams that chase churn and give real-time visibility into how your customer onboarding process.
1. Onboarding Completion Rate
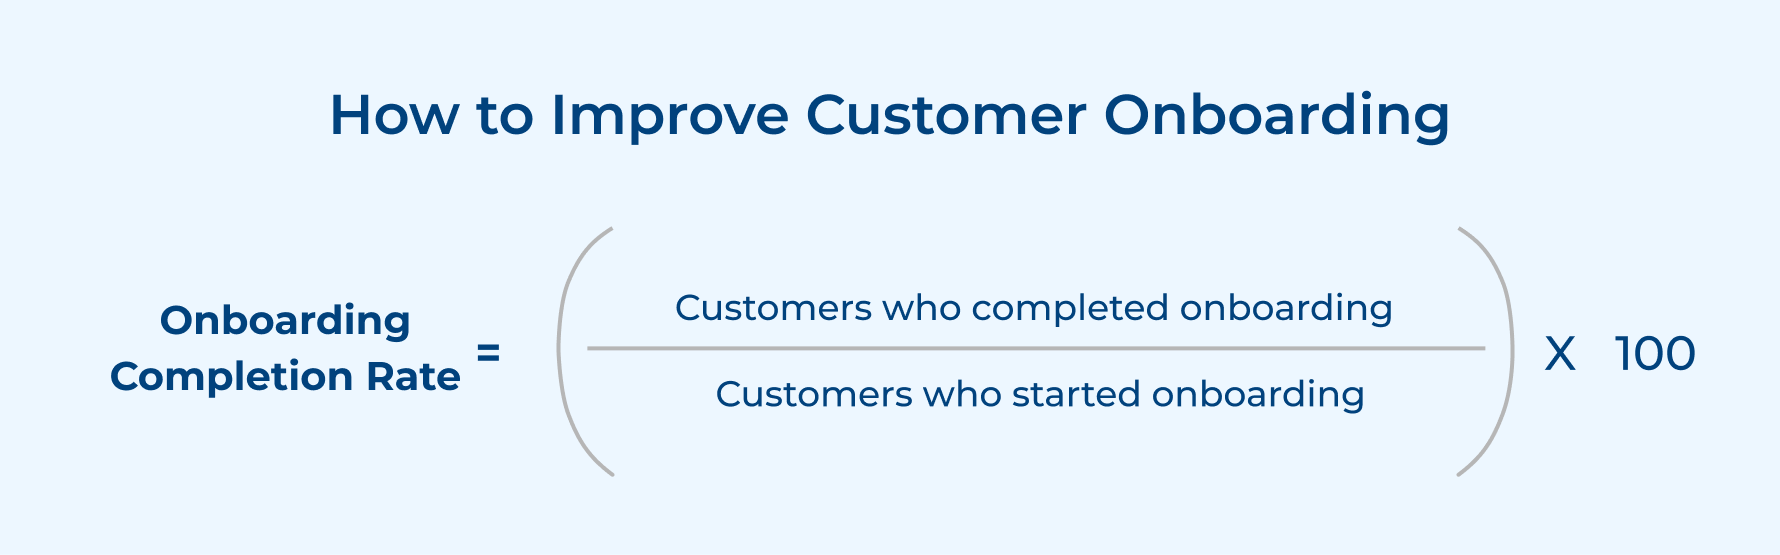
Onboarding completion rate is a metric that measures the percentage of users who have finished the signup process in your SaaS product. The indicator in your onboarding flow is clear and frictionless to take the customer from signup to activation.
Example:
– Customers started onboarding = 200
– Customers completed onboarding = 130
Calculation:
= (130 ÷ 200) × 100
= 0.65 × 100
= 65% Completion Rate
65% completion means an average friction in your flow and needs immediate optimization to improve activation.
What is a good benchmark for completion rate? Across SaaS businesses, a good customer onboarding completion rate between 60% and 80% is healthy. Below 50% means it needs a serious review.
Start calculating by breaking it down into steps to identify exactly where customers are stopping. It gives a precise friction point instead of a broad number that is hard to act on.
How to improve?
- Break onboarding into smaller milestones instead of one long, overwhelming flow
- Remove any steps that do not help customers reach their first value moment
- Maintain proper progress indicators for customers always know how close they are in the process
2. Time to Value (TTV)
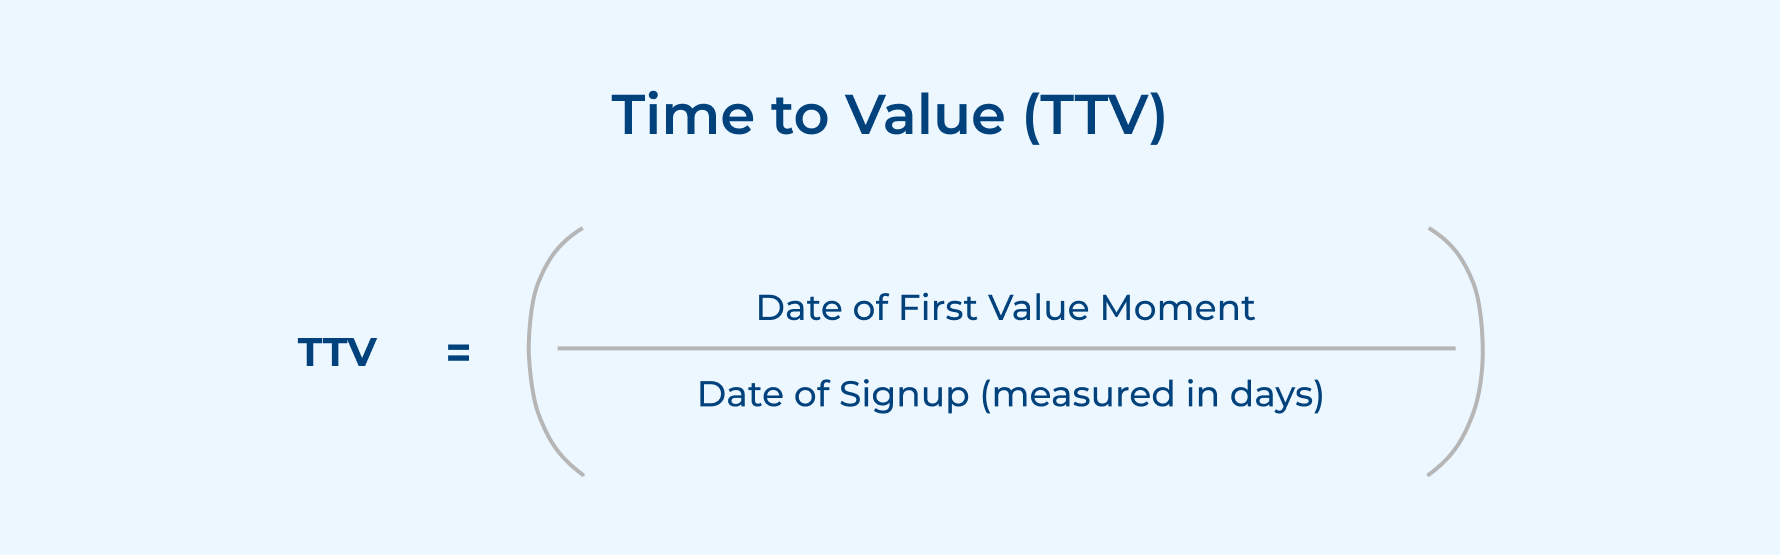
Each day spent by a new customer on the onboarding without experiencing real value leads to quietly reconsidering the purchase decision. Time to Value is a metric that measures the fast movement of customers from signup to their first success within the onboarding.
Consider these questions to diagnose your TTV:
- Are there any unnecessary steps that are delaying the customer onboarding?
- Is onboarding content aligned with customer needs?
- Do customers with shorter TTV show higher retention?
Reducing TTV is about removing everything that is not important to get them to value faster. Start auditing every onboarding step and ask if it moves the customer closer to their first win.
Consider these things that impact TTV:
- Personalization based on customer role or use case from the first day
- Trigger contextual in-app guidance at the exact moment when a customer needs
- Define the first value moment and build the entire flow based on it
3. Product Adoption Rate
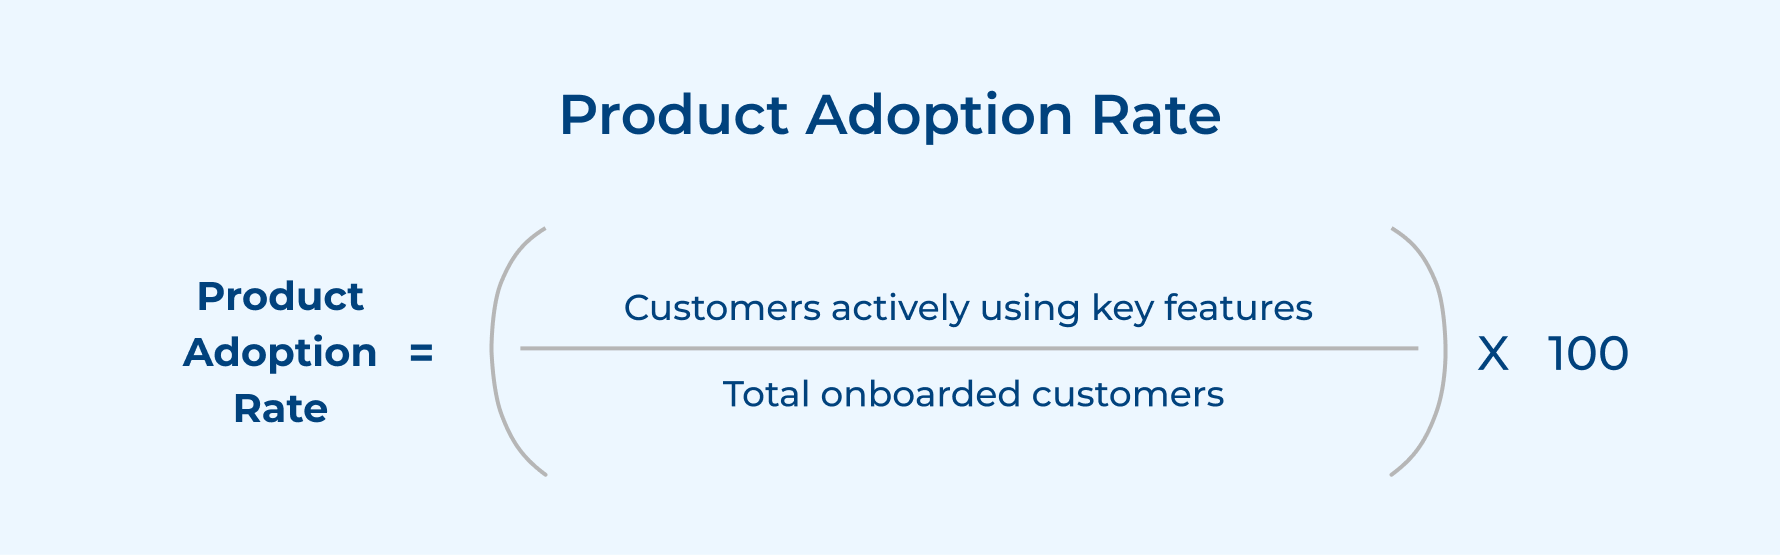
Product adoption rate tracks how customers are actually using the features that deliver core value. Low adoption in the first 30 days is an early churn signal among all SaaS client onboarding metrics and KPIs.
Example:
– Total onboarded customers = 300
– Customers actively using key features = 189
Calculation:
= (189 ÷ 300) × 100
= 0.63 × 100
= 63% Adoption Rate
Why is this metric more crucial than login frequency? Login frequency only tells the number of users who showed up, while the adoption rate shows if they actually did something meaningful with your product. A low adoption typically signals:
Early-stage drop-off: Customer completed signup but never engaged with any features
Shallow usage: Uses only one feature and ignores others that increase ROI
At-risk accounts: Low feature adoption consistently predicts upcoming churn
What is a standard benchmark for the adoption rate?
In most B2B SaaS products, 60% and 75% is a healthy adoption rates. Anything below usually points to a disconnected onboarding flow to the customer’s actual goals.
4. Customer Activation Rate
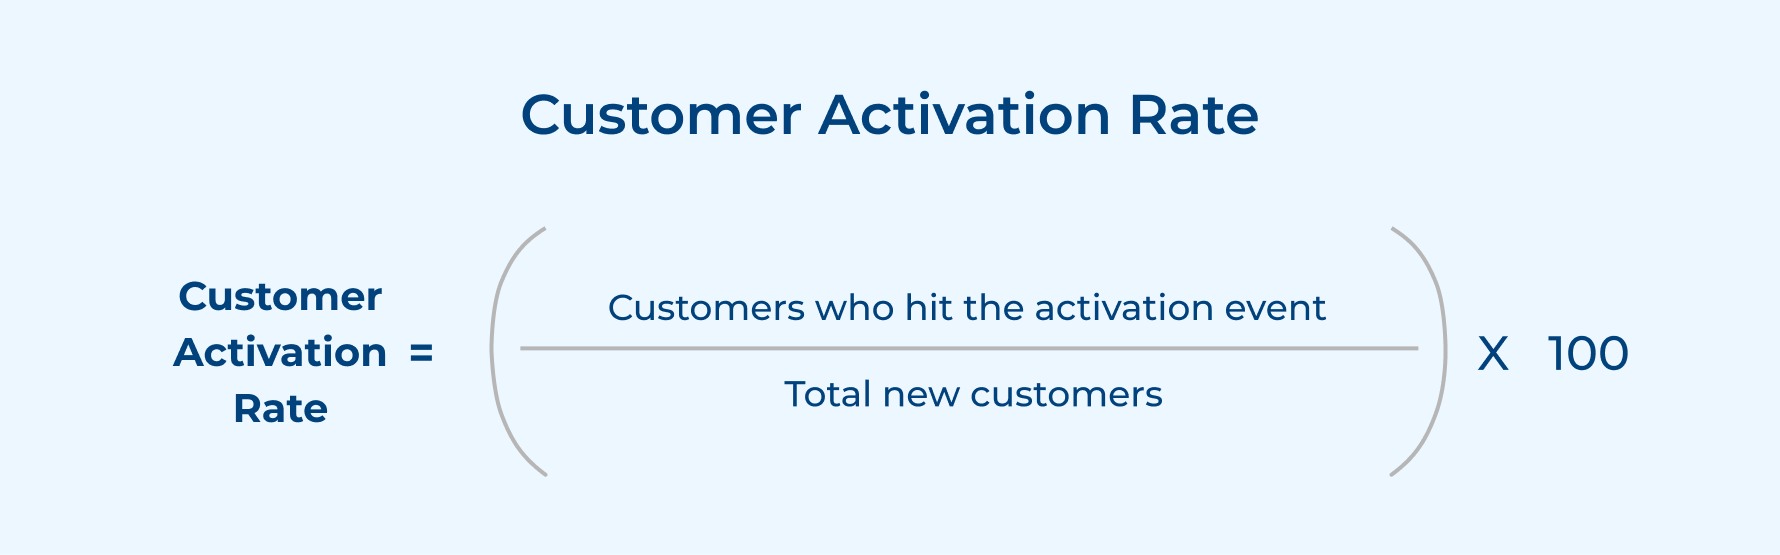
Activation rate is different from completion rate. The customer can finish your onboarding checklist, but never hit the moment where your product clicks for them. The metrics measure the number of clients that have reached the specific touchpoints in the onboarding process, which lead to predictive long-term retention.
Example:
– Total new customers = 500
– Customers who reached activation event = 210
Calculation:
= (210 ÷ 500) × 100
= 0.42 × 100
= 42% Activation Rate
42% activation means more than half of new customers never reach their value and also identify critical gaps that demand immediate redesign.
A standard benchmark of this onboarding metric for SaaS companies is above 60% and below 40% means your flow is not moving customers to value fast enough.
Increase your activation rate with these best practices:
- Identify the single action correlated with long-term retention.
- Remove steps between the signup and activation event that are not necessary
5. Customer Onboarding Engagement Rate
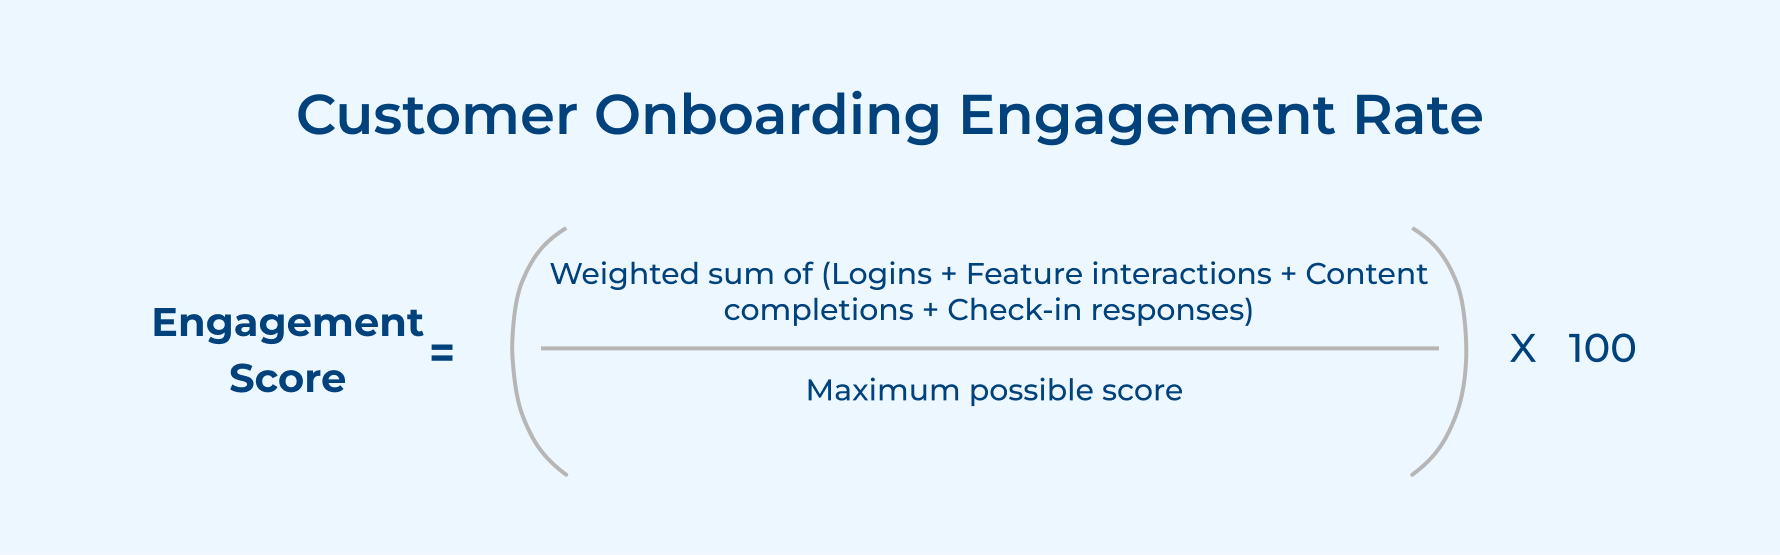
Does a single engagement tell the full story of the customer onboarding experience? Instead, use an engagement score that combines multiple behavioral signals such as sessions completed, features clicked and emails opened into one composite number that reflect overall onboarding health.
Example:
- Logins score = 20 (weight: 25%)
- Feature interactions score = 30 (weight: 35%)
- Content completions score = 25 (weight: 25%)
- Check-in responses score = 15 (weight: 15%)
Calculation:
= (20 × 0.25) + (30 × 0.35) + (25 × 0.25) + (15 × 0.15)
= 5 + 10.5 + 6.25 + 2.25
= 24 out of 100 Engagement Score
A low engagement score is not a signal of customer churn. It is an early warning where you still have time to act. Reach out to each low-scoring account within the first three weeks instead of waiting for them to raise a support ticket.
What should you include in your engagement score? The most reliable components across industries include:
- Number of logins and active sessions during the onboarding window
- Completion of onboarding tasks and product milestones
- Response rate on onboarding calls and check-ins
- Interaction with in-app guides and self-serve content.
6. Client Retention Rate (Early-Stage)
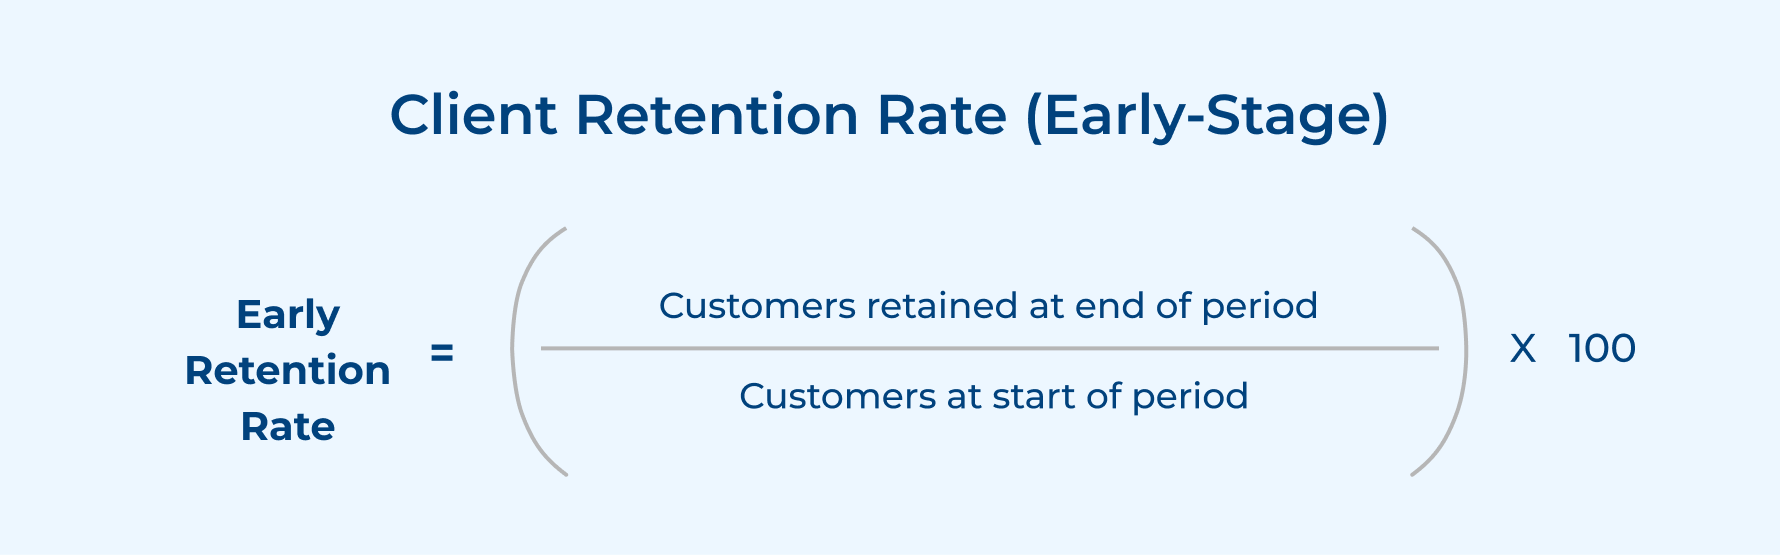
Measure retention at the 30, 60 and 90-day mark after user onboarding gives a more honest view than annual retention tracking. It displays whether the onboarding is delivered as promised by the sales team during the deal.
Example:
– Customers at start of 90-day period = 400
– Customers retained at end of 90 days = 340
Calculation:
= (340 ÷ 400) × 100
= 0.85 × 100
85% Early Retention Rate
A good retention rate for customers after onboarding is around 75% to 85%, while the remaining 15% is an early signal an onboarding gap needs investigating.
Consider these onboarding behaviors that predict strong early retention:
- The customer reached the activation phase within the first 14 days of signing up
- Customer engaged with two core features of the product during the onboarding window
- The customer had a meaningful touchpoint with your CS or onboarding team
7. Support Ticket Volume During Onboarding
Support tickets tracking raised during signup is the most underused customer onboarding success metric available. Every ticket generated during the process directly signals that your onboarding failed to meet customer expectations and needs the right guidance at the right moment.
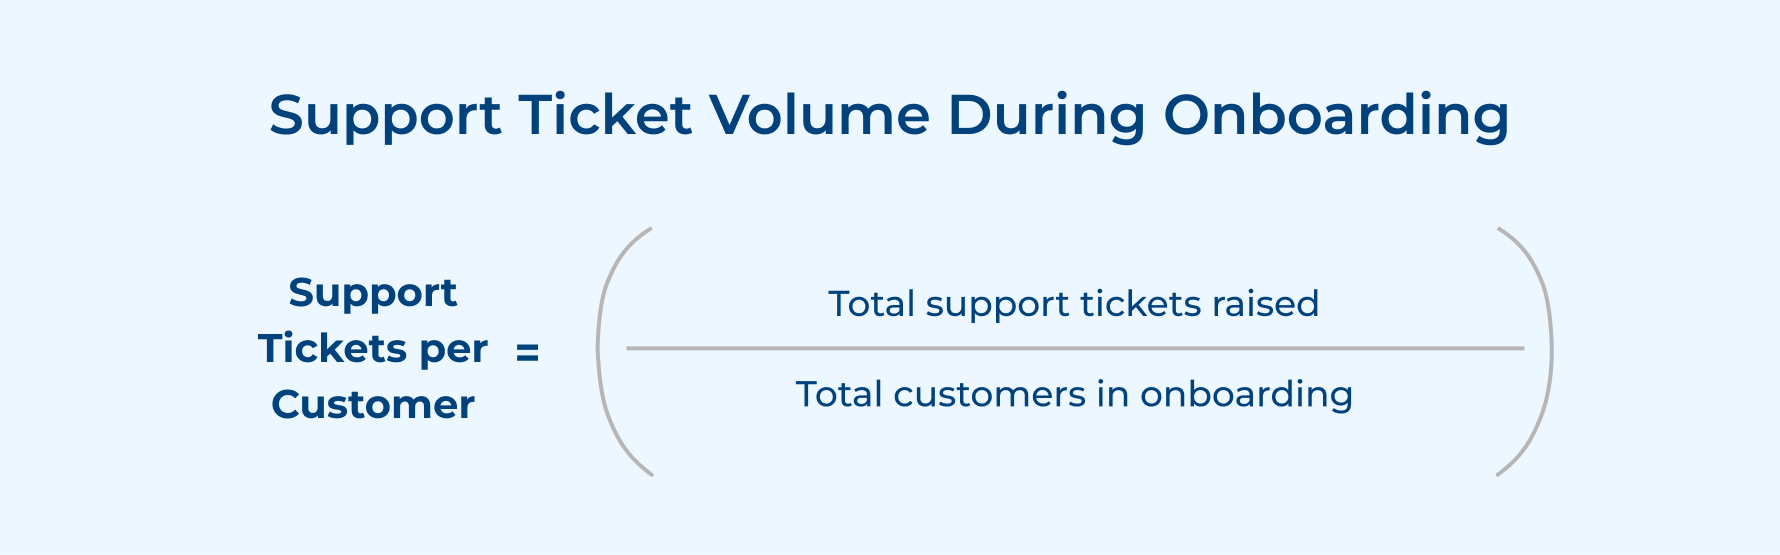
Example:
– Total support tickets raised = 340
– Total customers in onboarding = 170
Calculation:
= 340 ÷ 170
= 2.0 Tickets per Customer
Consider asking these questions when reviewing a support ticket:
- Are the same questions appearing repeatedly, which means there is a clear content gap in the flow?
- At which onboarding stage the majority of tickets raised?
- Are high-ticket customers showing lower retention numbers?
Answer to these questions helps in building self-serve answers and embedding them directly into the steps where confusion frequently occurs-
- Use recurring ticket themes to run an onboarding content audit and identify gaps proactively.
- Trigger an automated FAQ after the onboarding steps that generate most tickets
8. Net Promoter Score (NPS) at Onboarding Exit
The biggest mistake most teams make is sending NPS surveys only at renewal. Capturing it at onboarding exit gives far more valuable and actionable information. It reflects the customer’s sentiment at the exact moment of first real experience with your product.
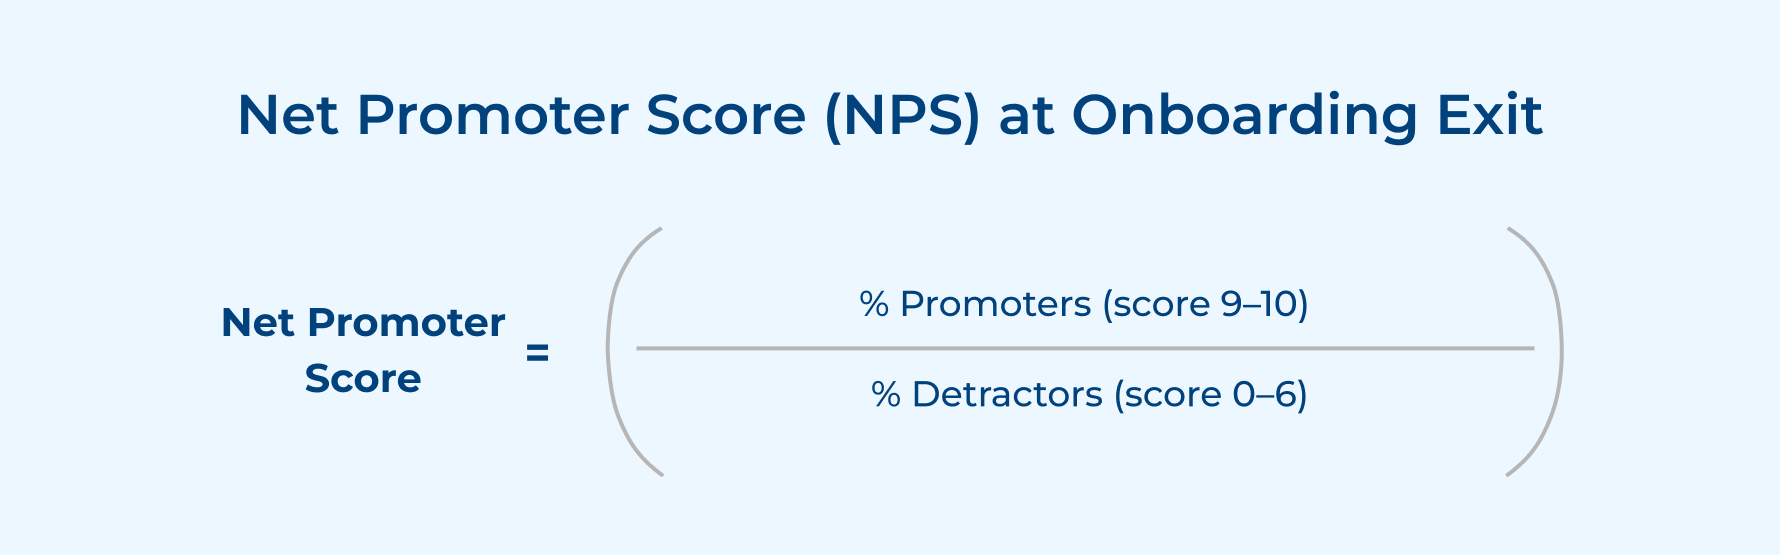
Example:
- Total respondents = 200
- Promoters (9–10) = 100 → 50%
- Passives (7–8) = 60 → 30%
- Detractors (0–6) = 40 → 20%
Calculation:
= 50% − 20%
= NPS Score of +30
What is a good benchmark for onboarding NPS? Customer exit onboarding with NPS above +30 is a solid indicator of experience is landing well, while below +10 suggests an underwhelming experience, instead of confidence about their purchase.
Here is how to act on each segment immediately:
- Promoters (9–10): Request a case study or review while sentiment is at its highest point
- Passives (7–8): Schedule a 30-day check-in to understand what fell short of a 9
- Detractors (0–6): Escalate immediately for a personal recovery call
9. Onboarding Drop-Off Rate
Drop-off rate shows the exact touchpoint where customers exit your onboarding flow. This is the most actionable set of user onboarding KPIs as it points out where the customer experience breaks down at a granular level.
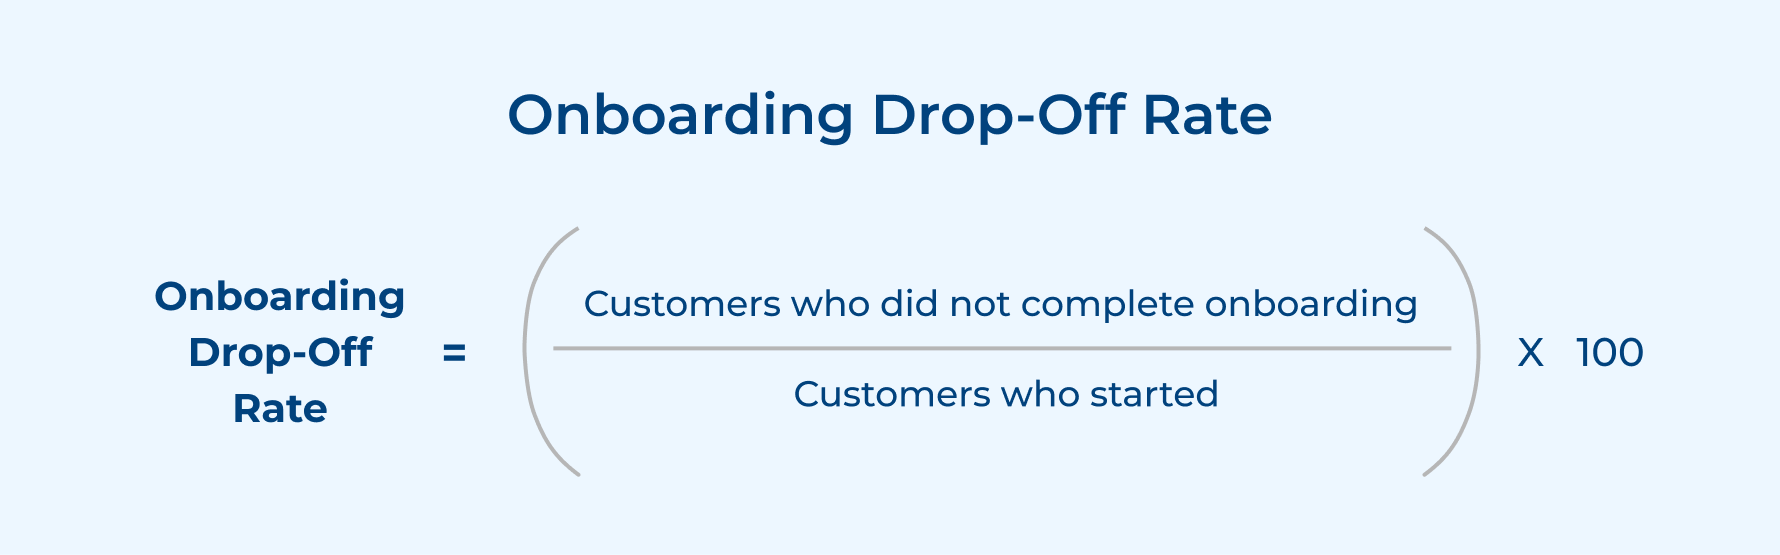
Calculate it by not just tracking overall drop-off, but by breaking it down step by step across the entire onboarding flow. For example, if one 20% customer exits at the initiation phase while 40% of customers exit at the integration setup, then these stages need to be redesigned before anything else.
What typically causes high drop-off rates?
- Multiple steps needed before the customer sees any value from the product
- Onboarding demands a complex setup without offering adequate real-time guidance
- No proper segmentation is followed based on customer type which means everyone receives the generic experience
10. Customer Health Score During Onboarding
Customer health score KPI gives your onboarding team a real-time probability of newly onboarded customers succeeding and staying long-term. It combines usage data, engagement signals, support history and milestone completion into one place to tell you exactly where to focus.
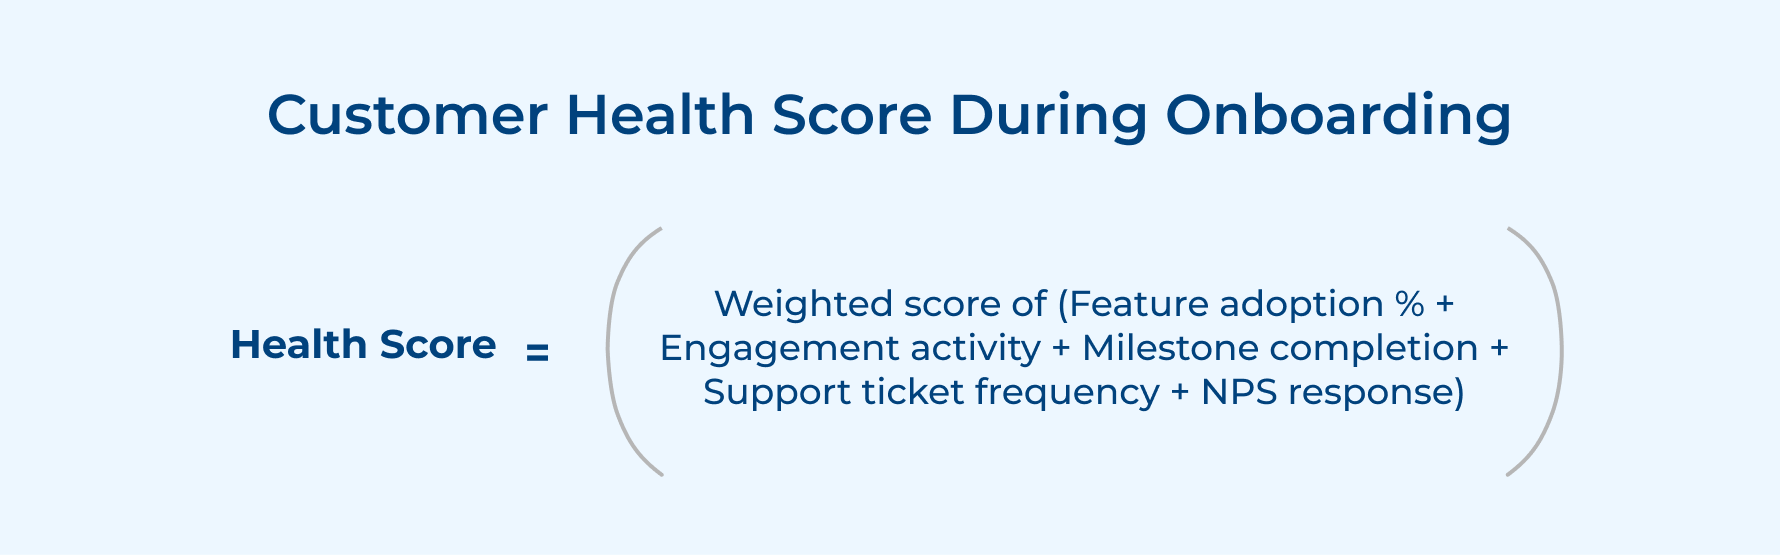
Example:
- Feature adoption score = 30 (weight: 30%)
- Engagement activity score = 25 (weight: 25%)
- Milestone completion score = 20 (weight: 20%)
- Support ticket frequency score = 15 (weight: 15%)
- NPS response score = 10 (weight: 10%)
What is a strong onboarding health score? It should have enough weights to assign each signal to reflect retention data. For example, the metrics in a complex B2B SaaS product measure customer onboarding completion rates that might carry more weight than login frequency, as finding key setup steps is a stronger point of long-term retention.
How to build a more accurate health score:
- Optimize your scoring weights every quarter based on churn and retention outcomes
- Segment health scores based on customer types so benchmarks reflect realistic expectations
- Share health score visibility across all teams so interventions are coordinated,
Tracking Customer Onboarding KPIs That Actually Drive Growth
Poor onboarding frustrates customers. It also silently kills retention and revenue before you even identify it. Customer success teams that consistently track client onboarding metrics turn risk into an advantage that scales over time.
- Metrics such as time-to-value and activation rate give early signals about the success f your onboarding framework
- Drop-off rate and support ticket volume identify friction inside your flow so you can fix it first
- Health score and early retention rate are reliable predictors of long-term success and revenue stability
Ready to elevate your onboarding experience? Start by auditing the metrics you are tracking and identifying the gaps that are affecting your retention. Businesses that treat customer onboarding metrics and KPIs as a growth lever are the ones that consistently convert new signups into customer loyalty.
Limit time — not creativity
Everything you need for customer support, marketing & sales.

Neeti Singh is a passionate content writer at Kooper, where he transforms complex concepts into clear, engaging and actionable content. With a keen eye for detail and a love for technology, Tushar Joshi crafts blog posts, guides and articles that help readers navigate the fast-evolving world of software solutions.